Chapter 6 of 11
Reading price momentum
A safe, fairly-priced dividend can still be falling. Momentum reads the price trend — a second lens beside yield and value.
Dividend investors rightly focus on the payout, but the share price still matters — a stock can pay a safe, growing dividend while its price drifts lower for years. Momentum is simply the strength of the price trend, and it's a useful complement to yield and value: value asks "is it cheap?", momentum asks "is the market already turning?"
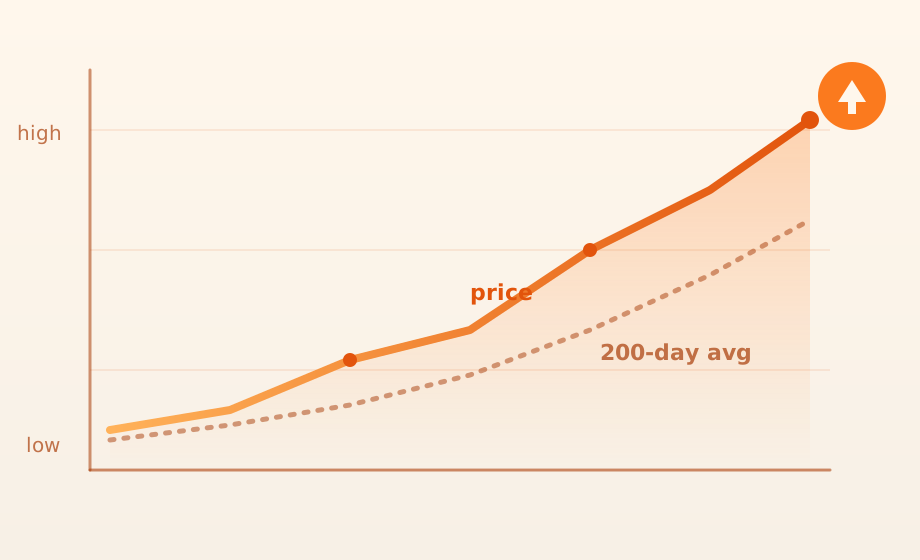
The simplest momentum signals are moving averages: the average closing price over the last 50 and 200 trading days. A price above both averages — and the shorter 50-day above the longer 200-day — signals an established uptrend; below them, a downtrend.
The 52-week position places today's price between its one-year low (0%) and high (100%). Near the high, a stock is making new ground; near the low, it's out of favour — which the value lens might read as cheap, so the two lenses often disagree, and that tension is the point.
Trailing returns — how much the price has risen over the last 6 and 12 months — round out the picture. Quantic combines these into a single 0–10 momentum score: higher means a stronger uptrend. Treat it as a trend read, never a valuation or a safety check — a high-momentum stock can be expensive, and a cheap one can keep falling.
The same price history reveals how bumpy the ride has been. The maximum drawdown is the worst peak-to-trough fall over the period — how far you'd have been down if you had bought at the high and held through the low. A shallow drawdown points to a steady holder; a deep one warns that even a reliable dividend can come with a stomach-churning price.
On the growth side, the Rule of 72 gives a quick feel for compounding: divide 72 by the dividend's growth rate as a percentage and you get the rough number of years for the income to double. A 6% raiser doubles its payout in about twelve years, a 9% raiser in eight — a reminder that a modest yield growing fast can overtake a high one standing still.
Momentum describes the recent past, which never guarantees the future. Read it alongside the dividend safety and value lenses, not instead of them.
Key terms
- Momentum
- How strongly a stock's price is trending up — trading above its moving averages, high in its 52-week range, with positive recent returns. A trend read, not a valuation: a stock can have strong momentum and still be expensive.
- 52-week position
- Where today's price sits between the 52-week low (0%) and high (100%). Near 100% means the stock is trading close to its yearly high — a momentum signal.
- Maximum drawdown
- The worst peak-to-trough drop in the share price over the available history — how much you'd have been down if you had bought at the high and held through the low. A plain gauge of how bumpy the ride has been.
- Dividend doubling time
- Roughly how many years until the dividend doubles if it keeps growing at its recent rate, using the Rule of 72 (72 ÷ the growth rate as a percentage). A quick feel for how fast your income compounds — a 6% raiser doubles its payout in about 12 years.
Quantic · Free
Ready to put it into practice?
Explore a sample portfolio — no signup — or create your free account and start tracking your own dividends.
Need more? Pro adds portfolios, options income tracking & more AI. See Pro →